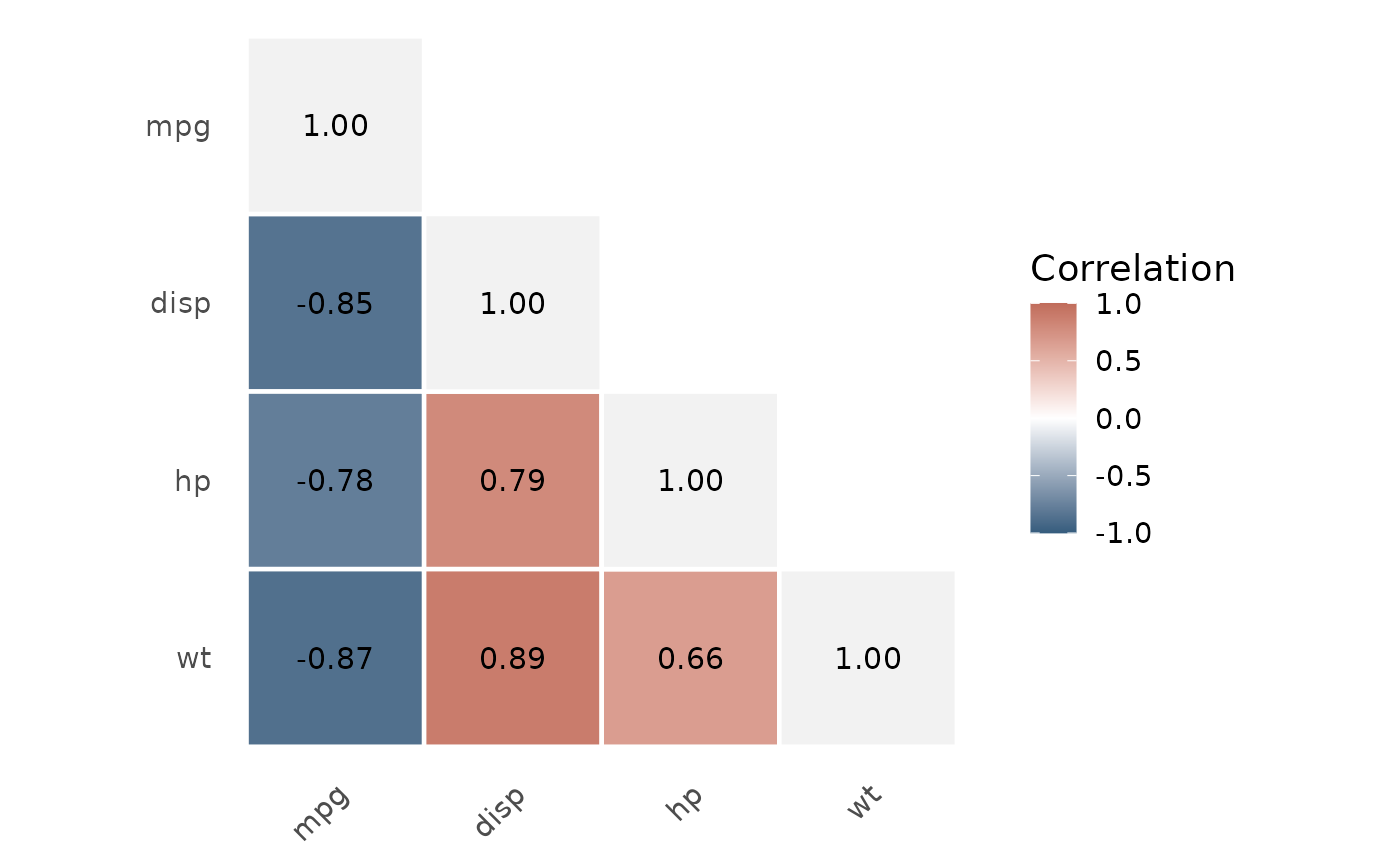
Plot the relationship between two continuous variables
Source:R/plot_correlation.R
plot_correlation.RdCreate a publication-ready scatterplot that is aligned with
correlation(). The minimal call is plot_correlation(data, x, y).
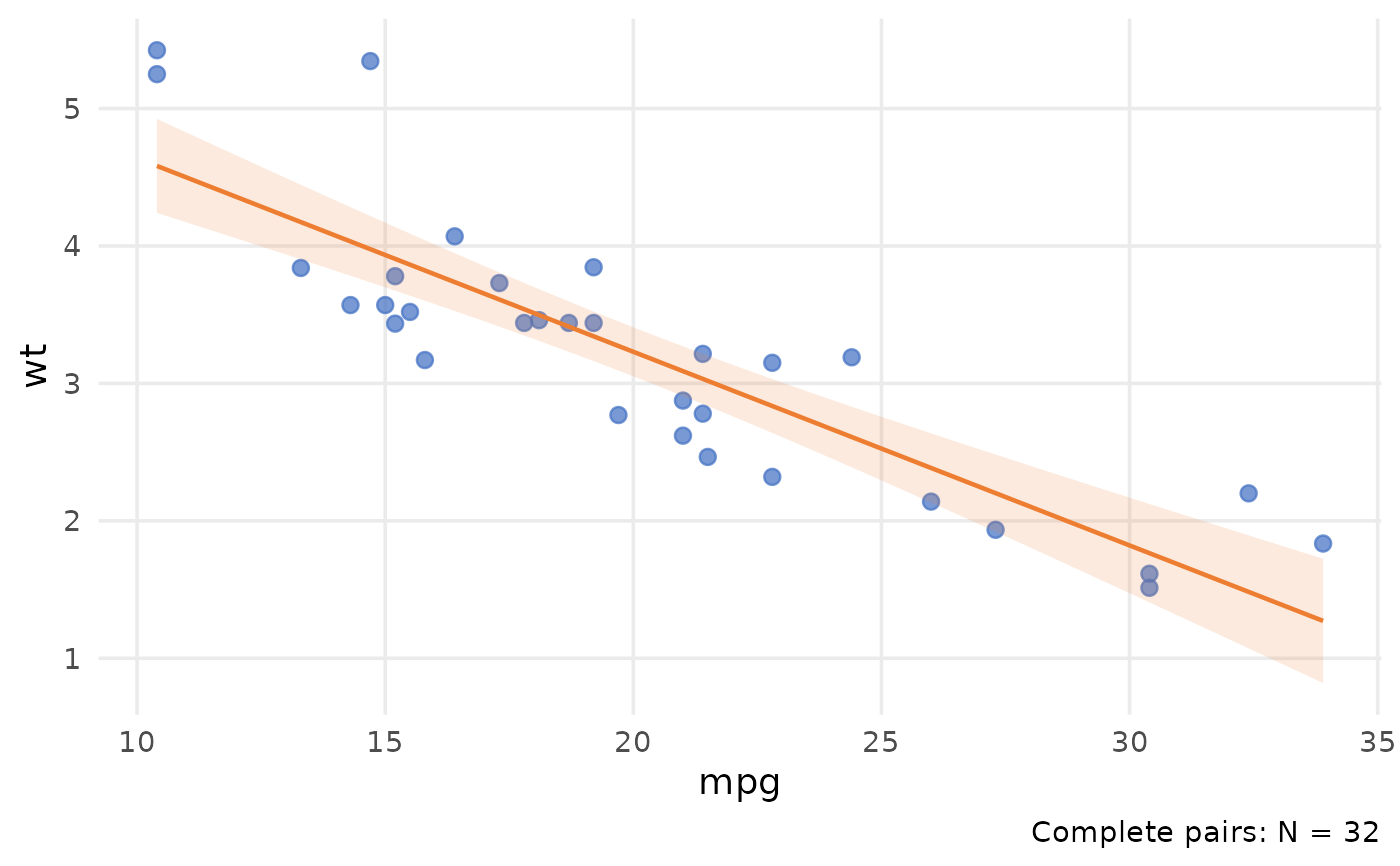
Incomplete pairs are excluded and the analysed number of complete pairs is
shown in the caption.
Usage
plot_correlation(
  data,
  x = NULL,
  y = NULL,
  method = c("auto", "pearson", "spearman"),
  trend = c("auto", "linear", "smooth", "none"),
  show_ci = TRUE,
  show_correlation = FALSE,
  conf.level = 0.95,
  digits = 2,
  point_color = "#4472C4",
  line_color = "#ED7D31",
  base_size = 14,
  title = NULL,
  caption = NULL,
  xlab = NULL,
  ylab = NULL,
  triangle = NULL,
  show_diagonal = NULL,
  show_values = TRUE,
  low_color = "#355C7D",
  mid_color = "#FFFFFF",
  high_color = "#C06C5B"
)
Arguments
- data
A data frame, or a matrix result returned by
correlation().- x, y
Continuous variables, supplied as bare names or character strings.
- method
Correlation method:
"auto","pearson", or"spearman".- trend
Fitted trend:
"auto","linear","smooth", or"none".- show_ci
Logical; display the confidence band around a fitted trend.
- show_correlation
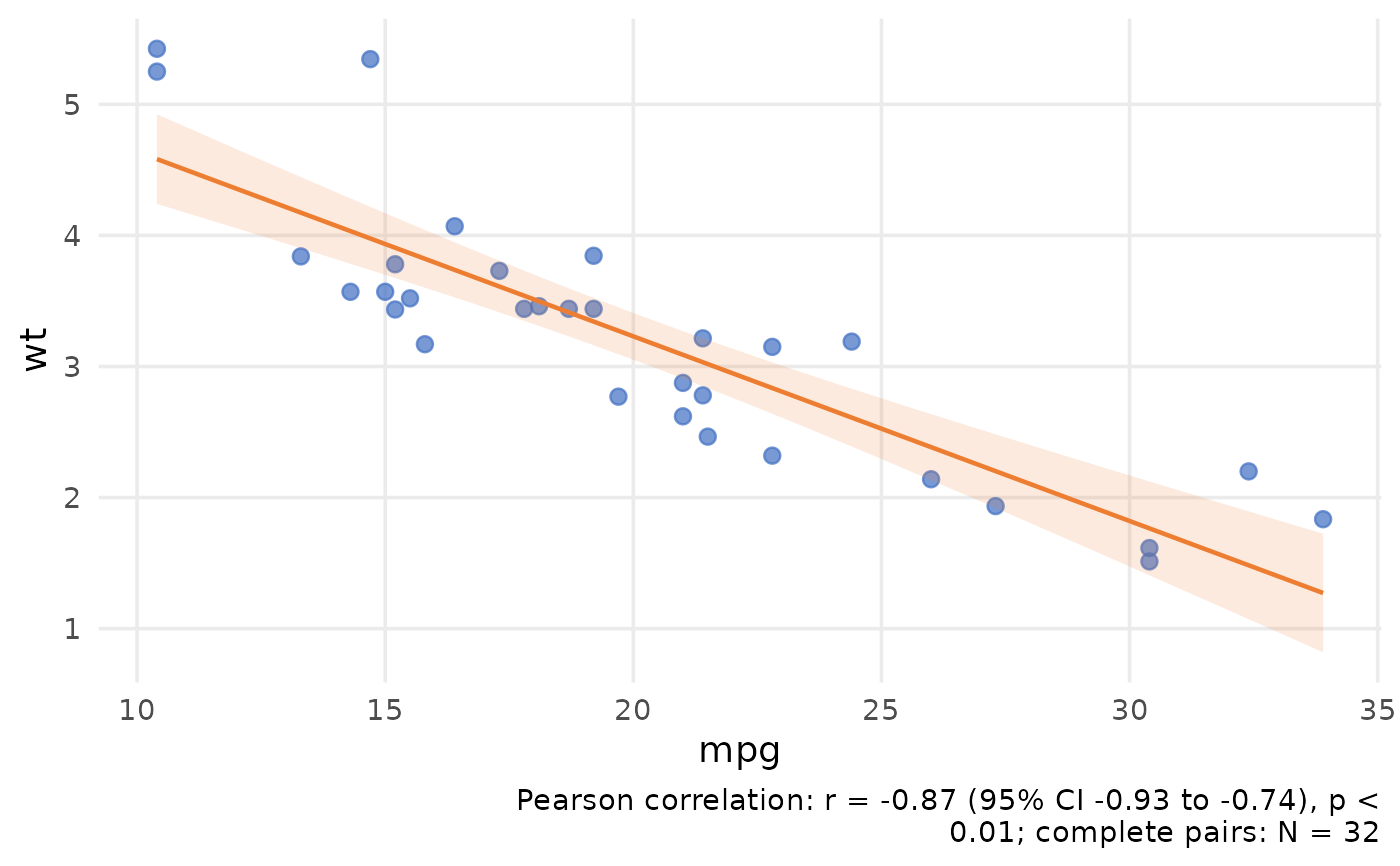
Logical; report the correlation result in the caption.
- conf.level
Confidence level passed to
correlation().- digits
Number of decimal places used in the correlation annotation.
- point_color, line_color
Colours used for observations and the trend.
- base_size
Base font size.
- title, caption
Optional plot title and caption.
- xlab, ylab
Optional axis labels.
- triangle
Matrix cells to show when
datais a correlation-matrix result:"lower","upper", or"full". The matrix object's setting is inherited whenNULL.- show_diagonal
Logical; show self-correlations in a matrix heatmap. The matrix object's setting is inherited when
NULL.- show_values
Logical; print coefficients inside heatmap cells.
- low_color, mid_color, high_color
Colours used by the matrix heatmap.
Details
With trend = "auto", a linear trend is used for Pearson correlation and a
smooth trend for Spearman correlation. Set trend = "none" to display the
observations alone. When show_correlation = TRUE, the caption reports the
same method, coefficient, confidence interval when available, and p-value as
correlation(). The returned object is a standard ggplot, so ordinary
ggplot2 layers can be added.
Examples
plot_correlation(mtcars, x = mpg, y = wt)
 plot_correlation(
mtcars,
x = mpg,
y = wt,
show_correlation = TRUE
)
plot_correlation(
mtcars,
x = mpg,
y = wt,
show_correlation = TRUE
)
 matrix_result <- correlation(mtcars, vars = c(mpg, disp, hp, wt))
plot_correlation(matrix_result)
matrix_result <- correlation(mtcars, vars = c(mpg, disp, hp, wt))
plot_correlation(matrix_result)