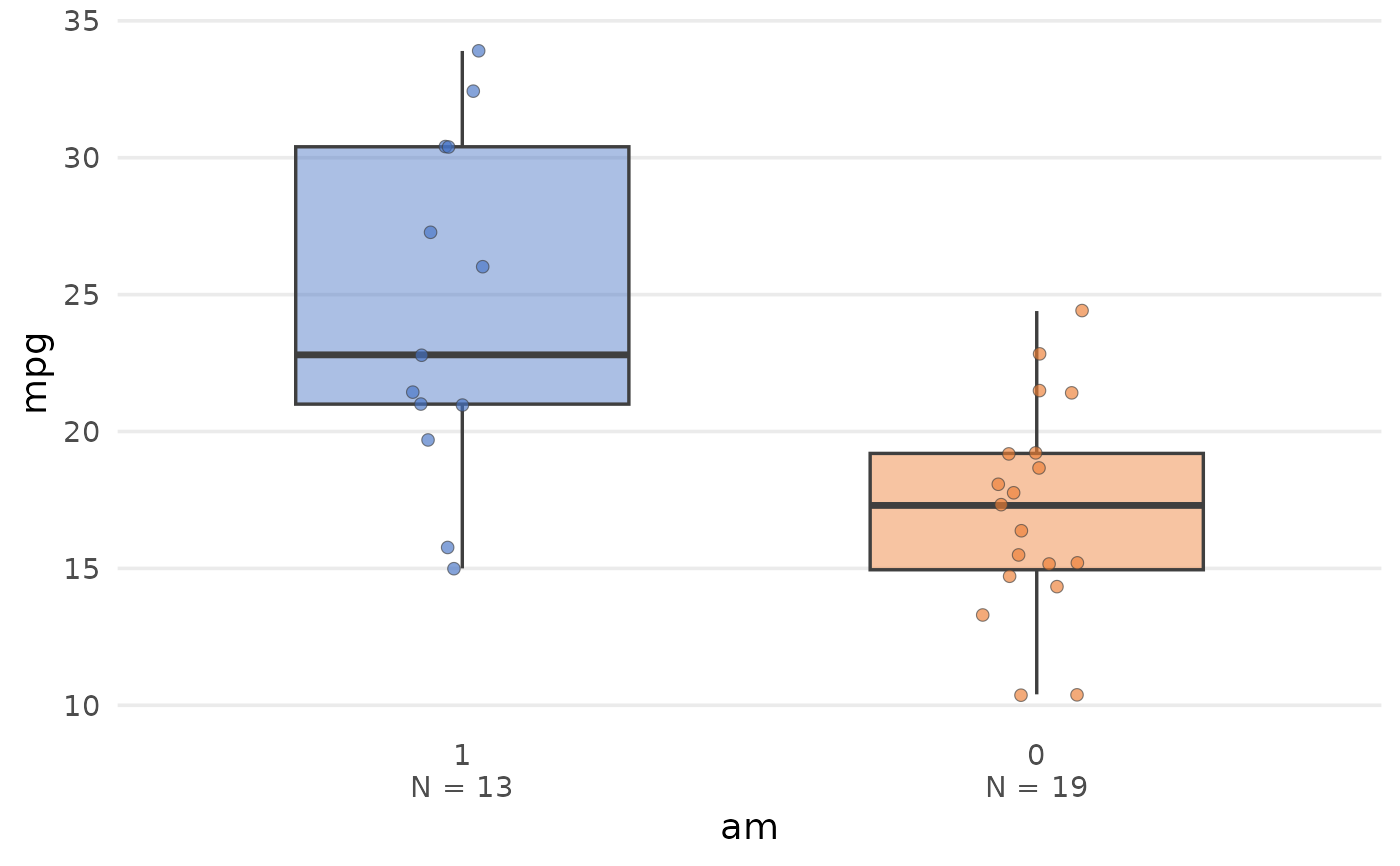
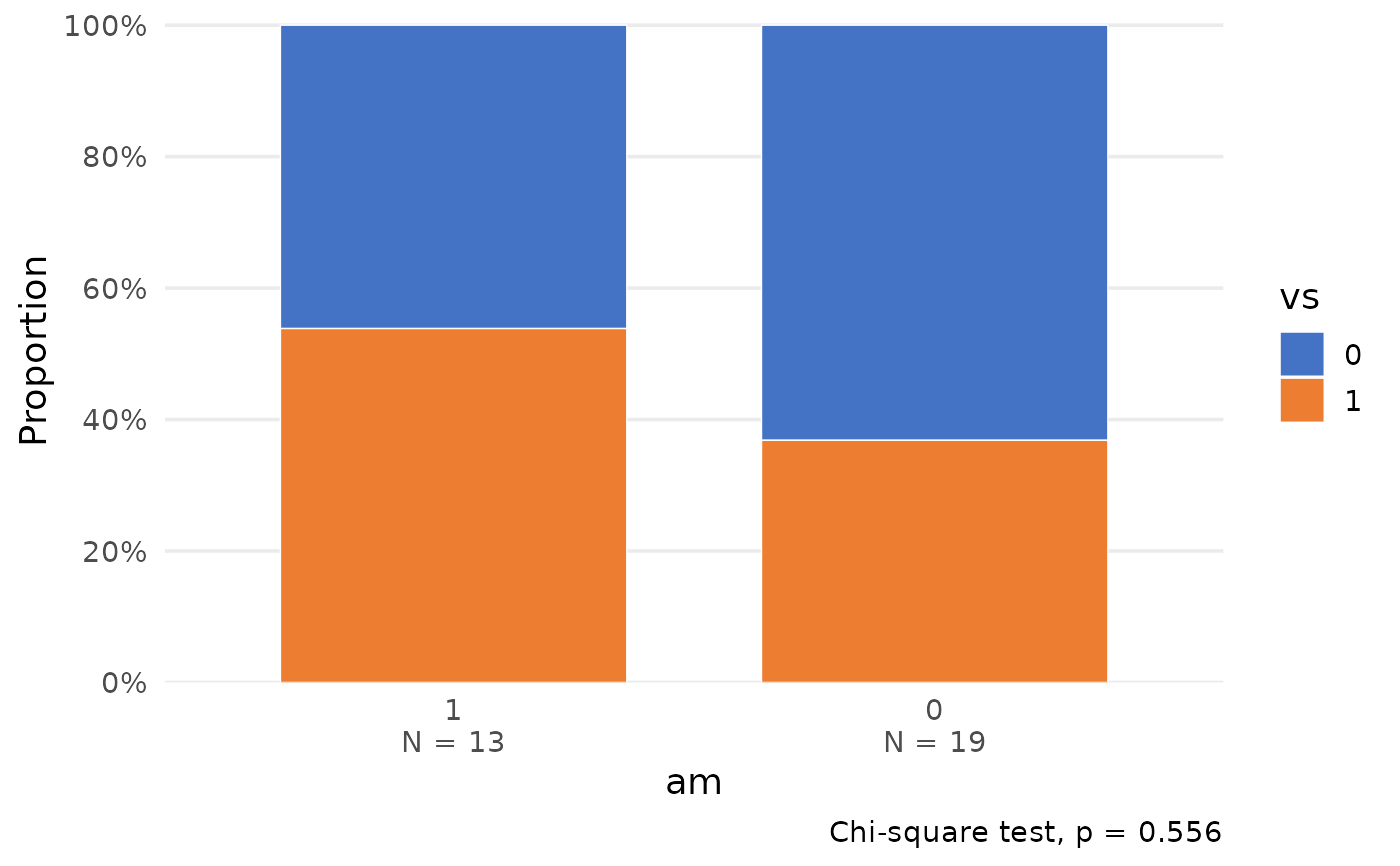
Create a publication-ready comparison plot using a sensible visual selected from the outcome type and study design.
Usage
plot_compare(
  data,
  variable,
  group,
  paired = FALSE,
  id = NULL,
  type = c("auto", "box", "bar"),
  display = c("proportion", "count"),
  show_points = TRUE,
  show_p = FALSE,
  test = c("auto", "t_test", "welch_t", "wilcox", "anova", "welch_anova", "kruskal",
    "chisq", "fisher", "mcnemar", "rm_anova", "friedman", "cochran_q"),
  var_equal = FALSE,
  palette = NULL,
  base_size = 14,
  title = NULL,
  caption = NULL,
  xlab = NULL,
  ylab = NULL,
  legend_title = NULL
)
Arguments
- data
A data frame.
- variable
Outcome or response variable, supplied as a bare name or character string.
- group
Categorical grouping variable, supplied as a bare name or character string.
- paired
Logical; whether observations are paired or repeatedly measured.
- id
Participant identifier required when
paired = TRUE.- type
Plot type:
"auto","box", or"bar".- display
Categorical display: within-group
"proportion"or"count".- show_points
Logical; show individual observations for continuous data.
- show_p
Logical; add the selected test and p-value as a plot caption.
- test
Test passed to
compare_groups()whenshow_p = TRUE.- var_equal
Logical; passed to
compare_groups()whenshow_p = TRUE. Withtest = "auto",TRUEselects the equal-variance parametric route for independent, non-skewed continuous outcomes. DefaultFALSEretains Welch methods; no variance test is performed.- palette
Optional character vector of colours. It must contain at least one colour per displayed group or outcome level.
- base_size
Base font size.
- title, caption
Optional plot title and caption.
- xlab, ylab
Optional axis labels.
- legend_title
Optional legend title.
Details
The minimal call is plot_compare(data, variable, group). Continuous outcomes
are shown as boxplots with individual observations, categorical outcomes as
stacked within-group proportions, and paired continuous outcomes as
participant-level connected observations. The returned object is a standard
ggplot and can be customized with ordinary ggplot2 layers.
When show_p = TRUE, the annotation is obtained from compare_groups() with
the same test, var_equal, paired, and id settings. The test name is always shown
with the p-value. The annotation and plotted denominators use the same
complete observations; non-finite continuous values are excluded.